Oct 17, 2019
Back to all Elements
1. Add the chart.js file to the project. Best is in the page/projects custom code section, before </body> tag.
2. Initiate a canvas with <canvas> tags (HTML embed widget)
3. Call the chart.js and configure options.
<script src="https://cdnjs.cloudflare.com/ajax/libs/Chart.js/2.8.0/Chart.js"></script>
<canvas id="myChart" width="400" height="400"></canvas>
<script>
var ctx = document.getElementById('myChart');
var myChart = new Chart(ctx, {
type: 'bar',
data: {
labels: ["1st", "2nd", "3rd", "4th", "5th"],
datasets: [{
label: 'Some Label',
data: [10, 20, 30, 40, 50],
backgroundColor: ["white", "#A5DBFF", "#B6E5F9", "#D1F0FF", "#8ED3FF"],
}]
},
});
</script>


When your bath soap bar gets too small to use, don't throw it away! open the next bar, and when you finish showering, stick the small old bar to the back of the new bar. Onces they both dry, they will become one.


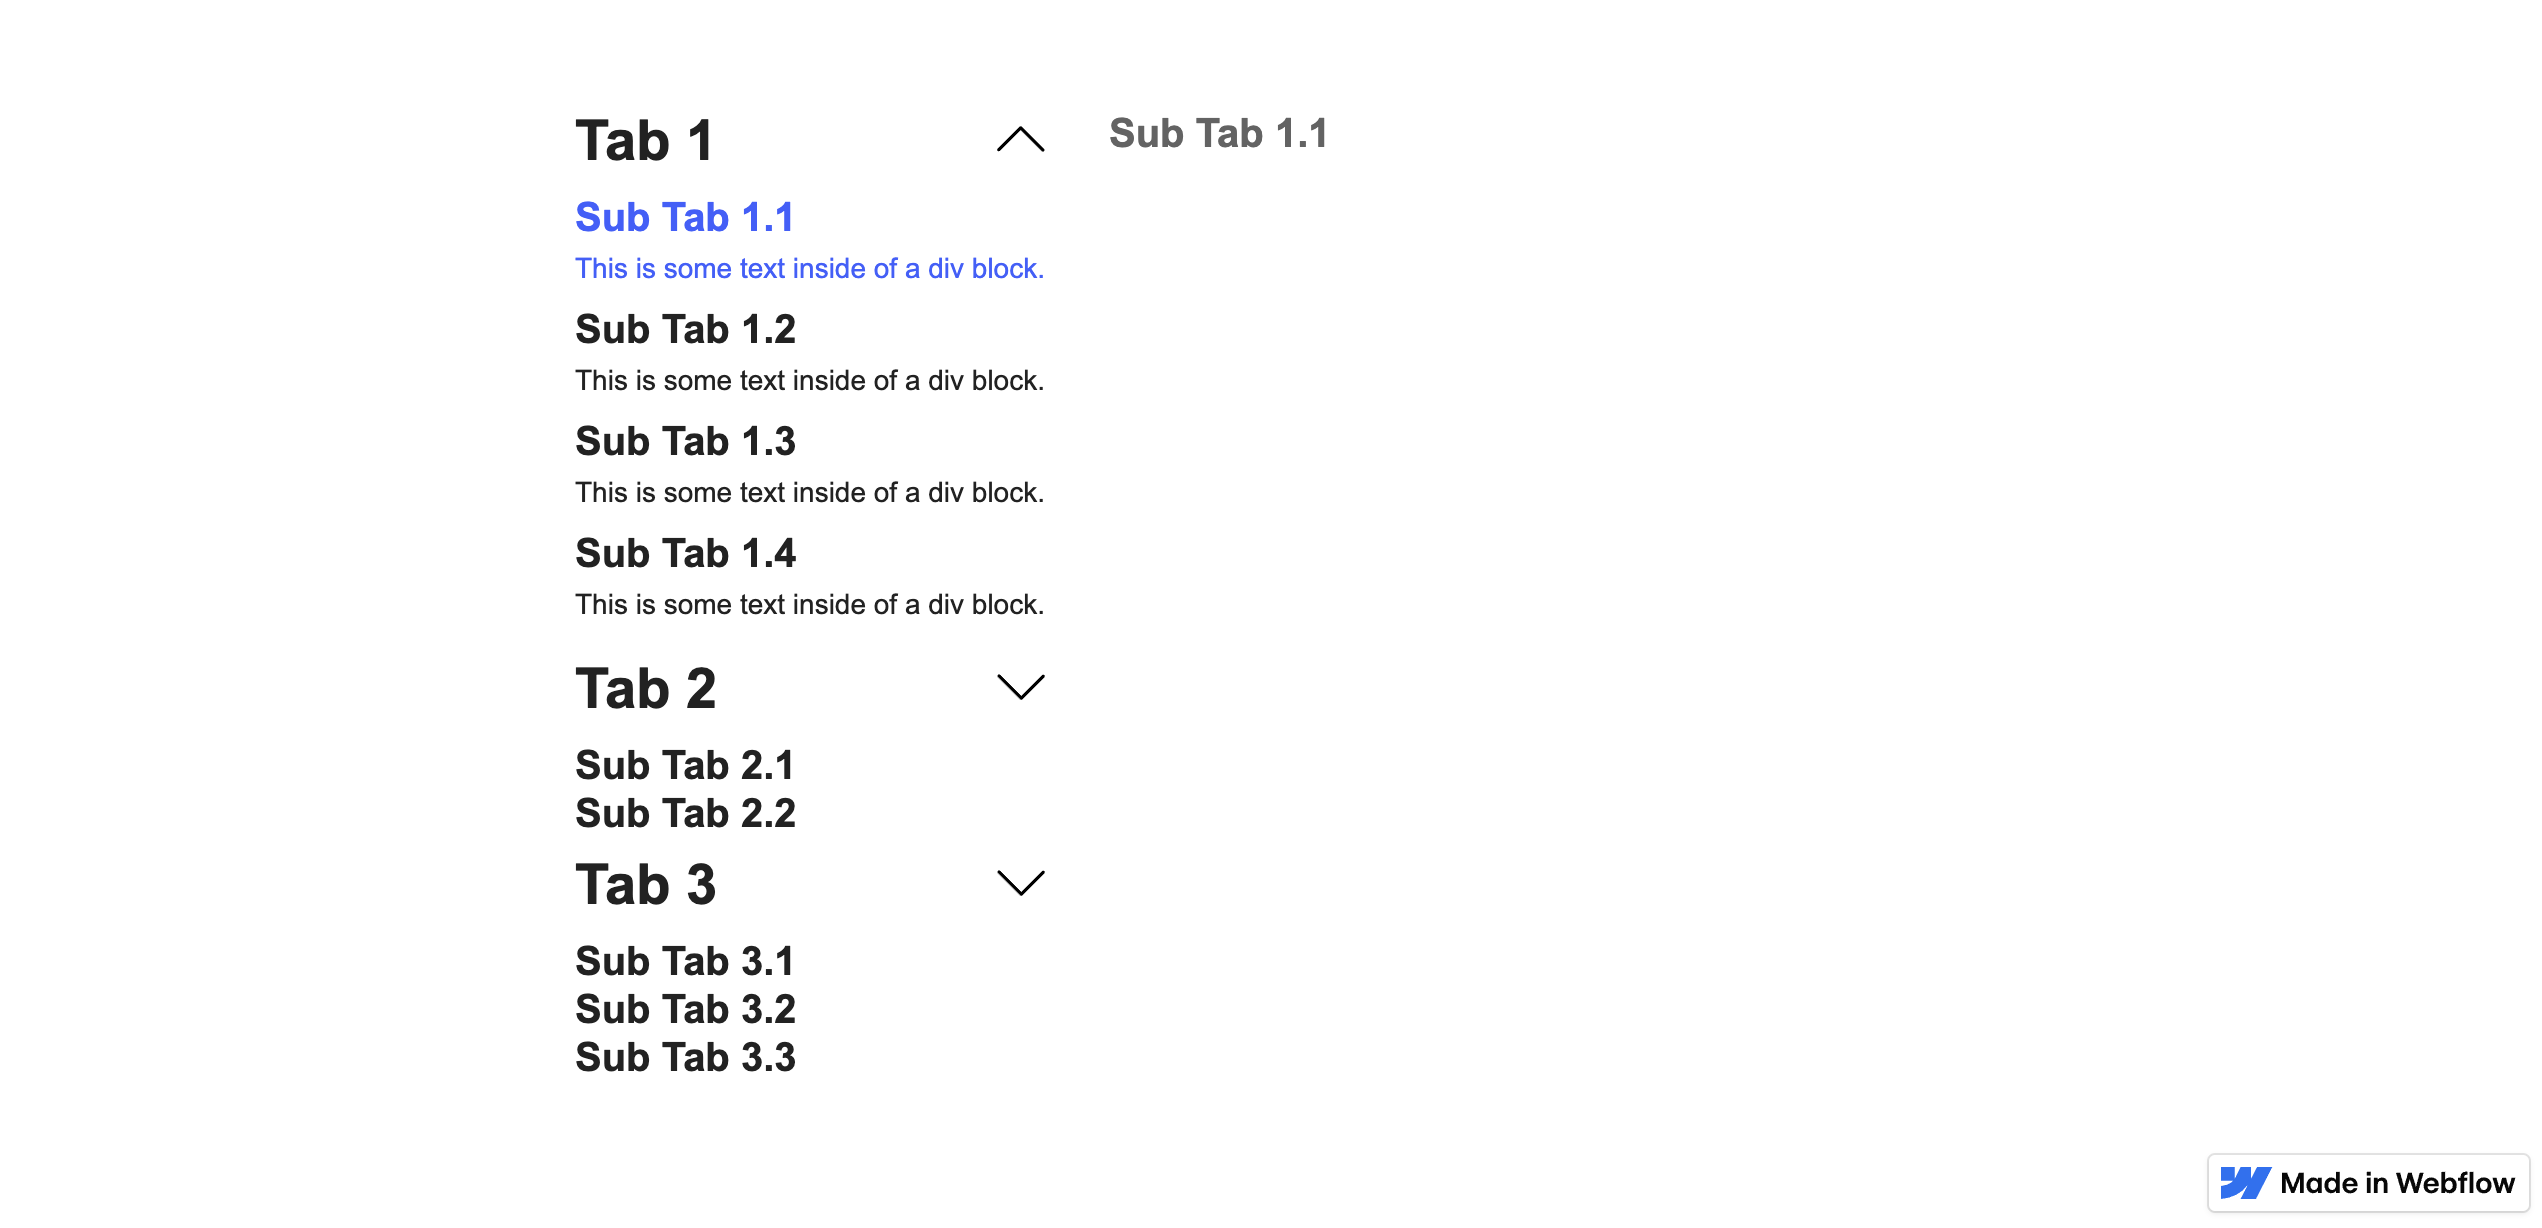
Nested tabs in an accordion template

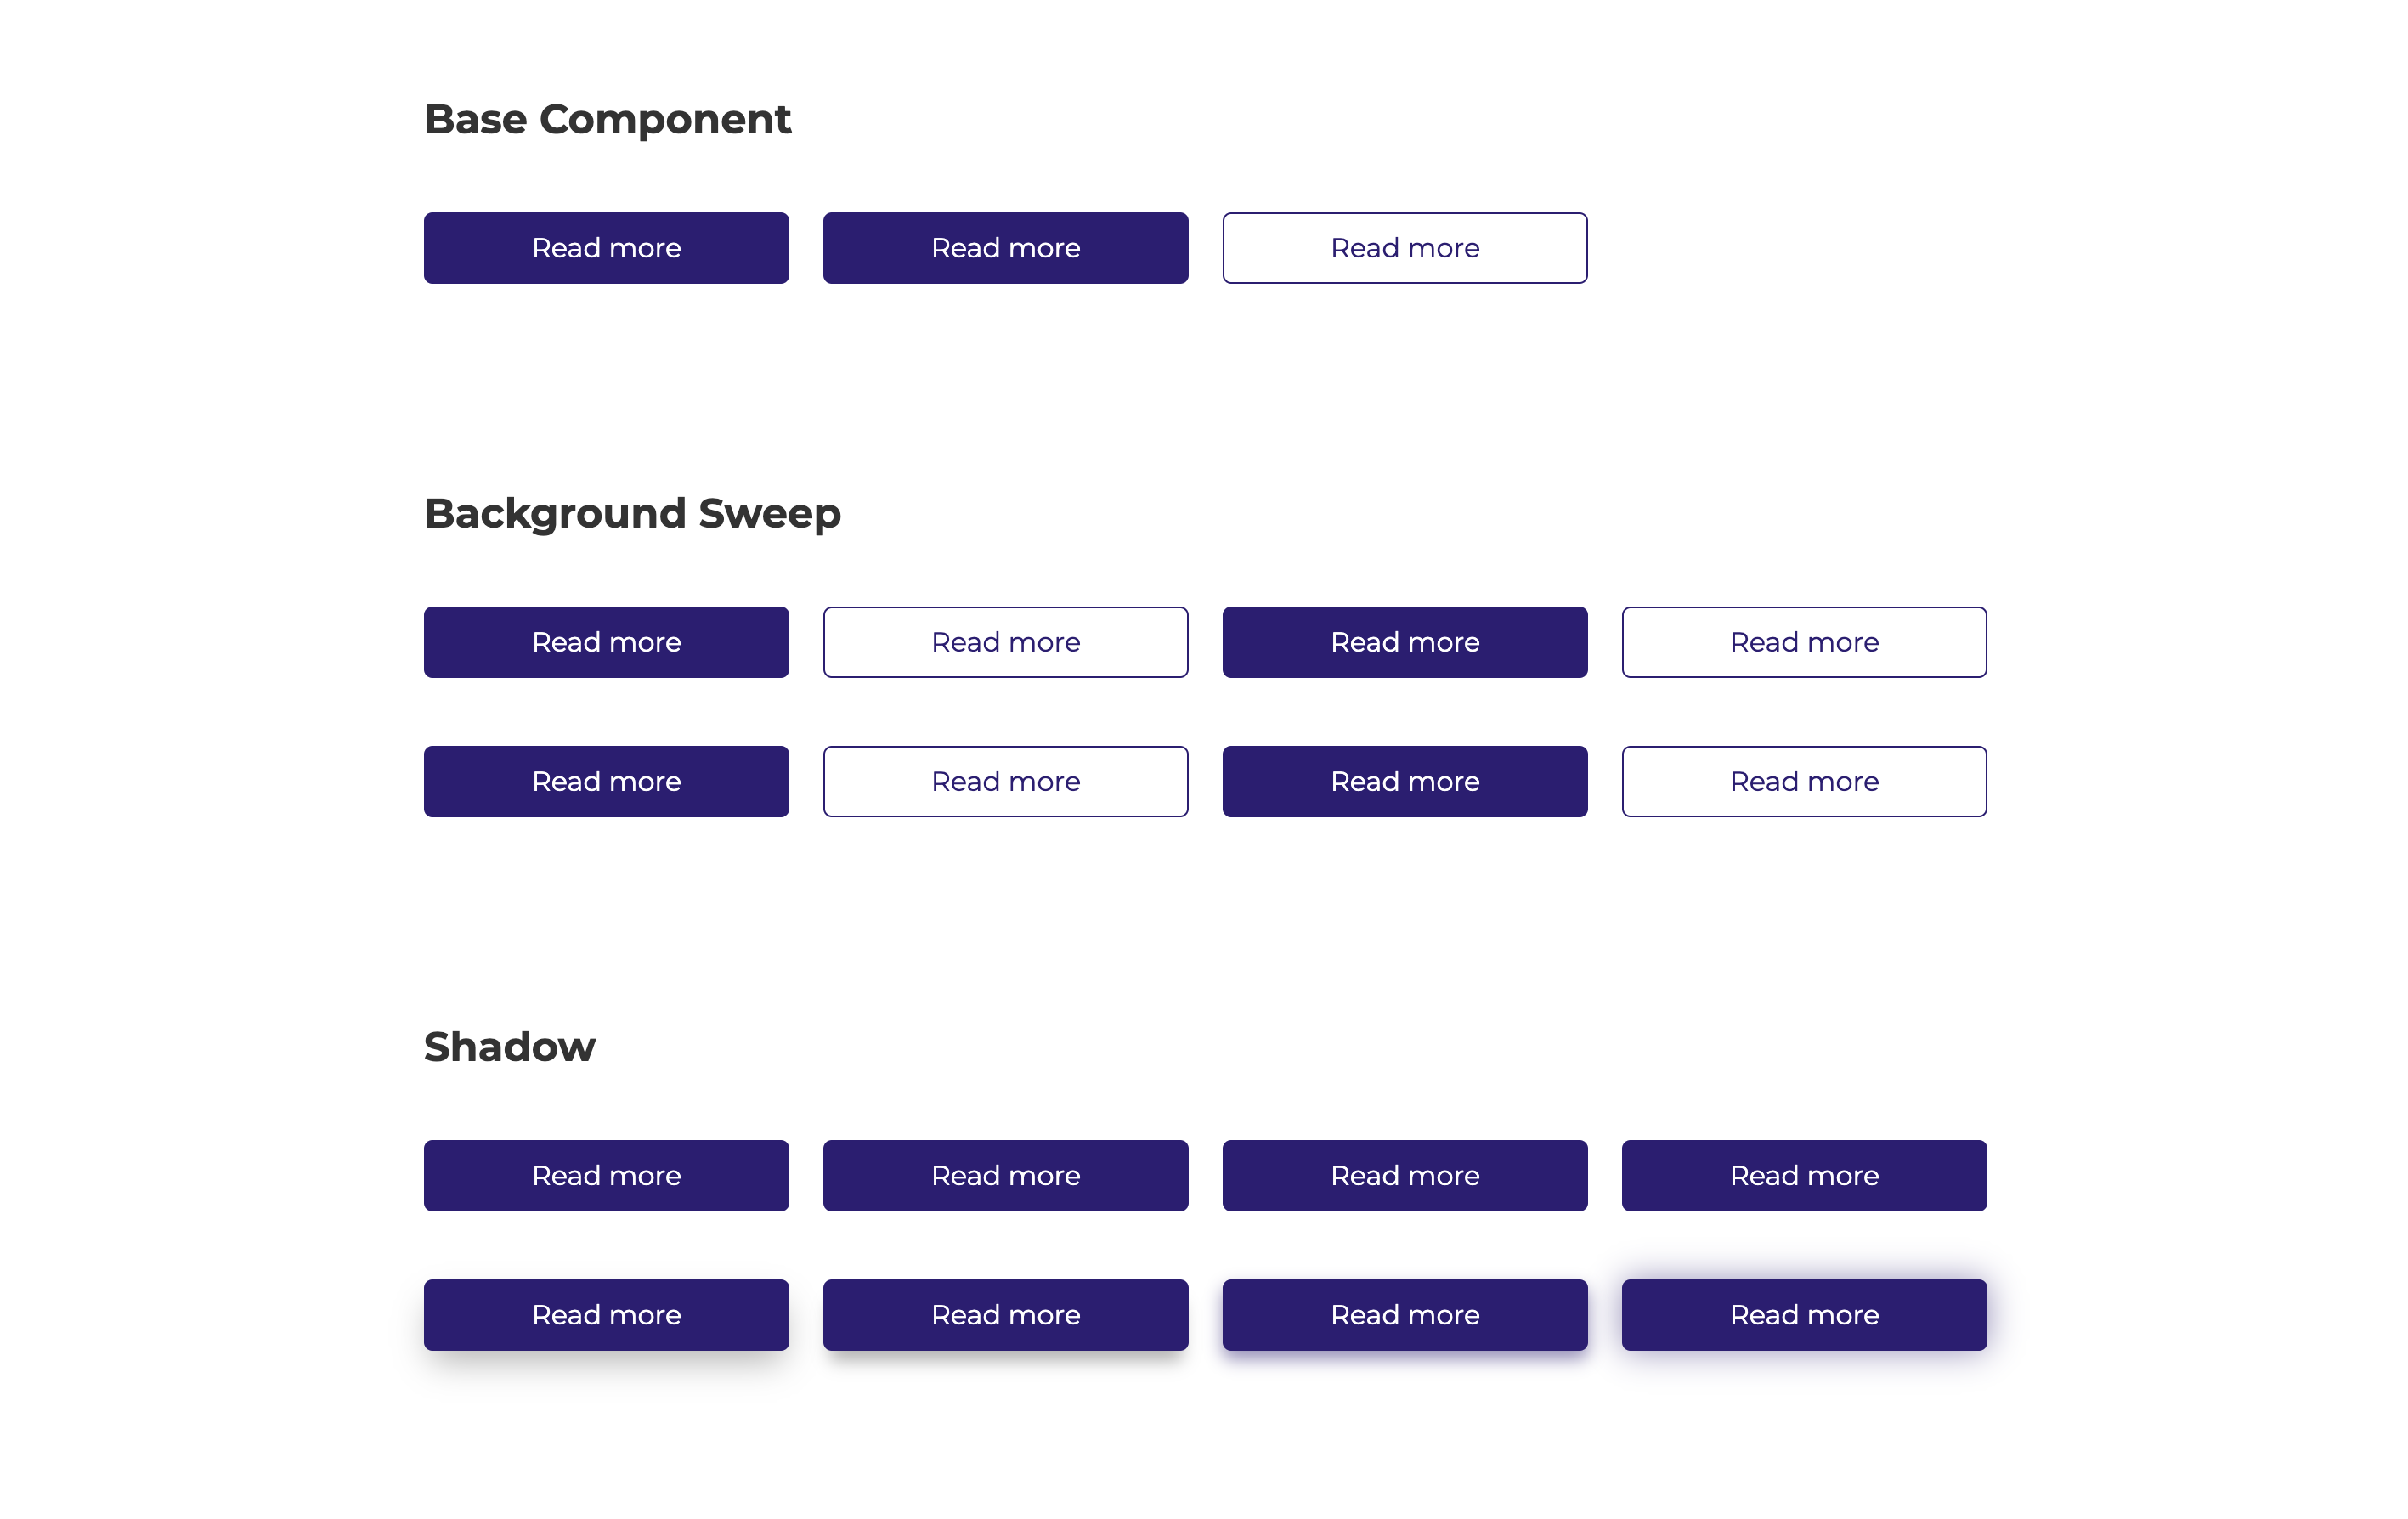
A small collection of buttons and hover interactions.

A 3d slider with video items, plays and pauses on click & slide change.